Capturing Parameters of a Stored Procedure Call
Introduction
Recently a user on the PSSUG mailing list asked how he could capture the parameters passed to a stored procedure on every execution. In this article I would like to show a few different options to accomplish that.
Tracing
The first option you have is to run a trace. There are two events of interest here: sp:starting and RPC:starting. When setting up the trace, both events can be filtered on the ObjectName column to only capture calls of the procedure in question. sp:starting can also be filtered on the ObjectId column for the same purpose.

sp:starting captures the lines in the input buffer that make up the current call to the procedure. If the procedure is called directly from an application, you will be able to see that parameters in here. The TextData column will contain something like this:
EXEC dbo.Traceable @P1 = 17, @P2 = 'StrVal1', @P3 = '2012-03-04 05:06:07.08';
If however the procedure gets called in a batch or from within another procedure and the parameters passed are stored in variables, you are out of luck as you will only get to see the names of those variables:
EXEC dbo.Traceable @P1 = @V1, @P2 = @V2, @P3 = @V3;
The RPC:starting event fires only, if the procedure is called directly from an application. It does not fire at all when the stored procedure call is part of a batch or from within another procedure, so it does not help with the above problem either. However, it does have the advantage that it also fires, if the call from the application did not result in an execution, for example because a parameter name was messed up. In that case you will get all parameters of the erroneous call listed, again in the TextData field:
exec dbo.Traceable @P1=19,@P2=N'StrVal4',@WrongParameter='2012-05-16 19:15:59.297'
Because the procedure won't start executing in this case, the sp:starting event does not fire at all.
So both events do not cover all cases. If you are trying to see all calls to a procedure from an application, go with RPC:starting. If on the other hand the procedure gets executed as part of a bigger batch or from within another procedure, use sp:starting but be aware that variable usage might hide the actual parameter values from you.
Active Logging
If the two mentioned trace events do not get you where you need to be, you have another option:
Rename the original procedure and create a new one that first logs the parameters to a table and then calls the (renamed) original procedure.
The following script creates a procedure dbo.Traceable. This is the procedure we want to trace. Its original behavior is to return a single result set.
GO
CREATE PROCEDURE dbo.Traceable
@P1 INT,
@P2 NVARCHAR(33),
@P3 DATETIME
AS
BEGIN
SELECT @P1 [dbo.Traceable], @P2 got, @P3 [called!];
END
[/sql]
To setup logging for this procedure you can run the following script:
EXEC sp_rename @objname = 'dbo.Traceable', @newname = 'Traceable_Spyed';
CREATE TABLE dbo.Traceable_Log
(
Id INT IDENTITY(1, 1) PRIMARY KEY CLUSTERED ,
P1 INT ,
P2 NVARCHAR(33) ,
P3 DATETIME ,
LogDTime DATETIME2 DEFAULT SYSDATETIME()
);
GO
CREATE PROCEDURE dbo.Traceable
@P1 INT,
@P2 NVARCHAR(33),
@P3 DATETIME
AS
BEGIN
INSERT INTO dbo.Traceable_Log
( P1, P2, P3 )
VALUES ( @P1, @P2, @P3 );
EXEC dbo.Traceable_Spyed @P1 = @P1, @P2 = @P2, @P3 = @P3;
END
GO
COMMIT;
[/sql]
When modifying this script for your own purposes, make sure that the @newname parameter of sp_rename does not contain the schema name. Otherwise the renamed object will end up with a name like [dbo].[dbo.Traceable_Spyed] which will be very inconvenient. You also might want to check that dbo.Traceable_Spyed does not exist already to protect against double execution.
With this in place, every successful call to the procedure will get logged. The log table also establishes an execution order and has timestamps:

To uninstall this logging wrapper, just execute the following code:
DROP PROCEDURE dbo.Traceable;
EXEC sp_rename @objname = 'dbo.Traceable_Spyed', @newname = 'Traceable';
COMMIT;
[/sql]
Again you might want to add code to protect from double execution by checking that dbo.Traceable_Spyed does exist before dropping dbo.Traceable.
Alternative Solution
Both above mentioned options have their drawbacks. The first might not capture all parameters in all cases and might therefore just not work at all for you. The second one requires that you have the ability to rename objects and replace them with your own. There might be many reasons preventing you from doing that.
If you are stuck because of that, there is one more option: The Showplan XML Statistics Profile trace event. You can find more information about this event - including how to filter it - here: Tracing the Actual Execution Plan for a single Query
This event captures the actual execution plan of the procedure (or batch) after each single execution. The execution plans are captured in XML format and stored in the TextData column. To access it from there after you inserted the trace data into a table, you have to cast the TextData column to XML:
[/sql]
Inside the execution plan look for the ParameterList node. It will look something like this:
<ColumnReference Column="@P3" ParameterCompiledValue="'2012-03-04 05:06:07.080'" ParameterRuntimeValue="'2012-03-04 05:06:07.080'" />
<ColumnReference Column="@P2" ParameterCompiledValue="N'StrVal1'" ParameterRuntimeValue="N'StrVal1'" />
<ColumnReference Column="@P1" ParameterCompiledValue="(17)" ParameterRuntimeValue="(17)" />
</ParameterList>
[/xml]
It does not only provide you with the parameter values of the current execution (ParameterRuntimeValue), it also lists the parameter values that were used when compiling the execution plan (ParameterCompiledValue). This can be very useful when you are trying to hunt down parameter sniffing issues.
However, you need to be aware that this is a fairly large event. So make sure you use the server side trace functionality instead of the Profiler UI and also make sure to have enough disk space available on the drive that you are writing the trace file to. You also should set a maximum file size in the trace definition.
Happy Tracing!
Newsletter Sign Up

We know how to make a database not slow. We’ll help you do the same.
From the sqlity.net blog
-
How to identify the SQL Server Service Account in T-SQL

-
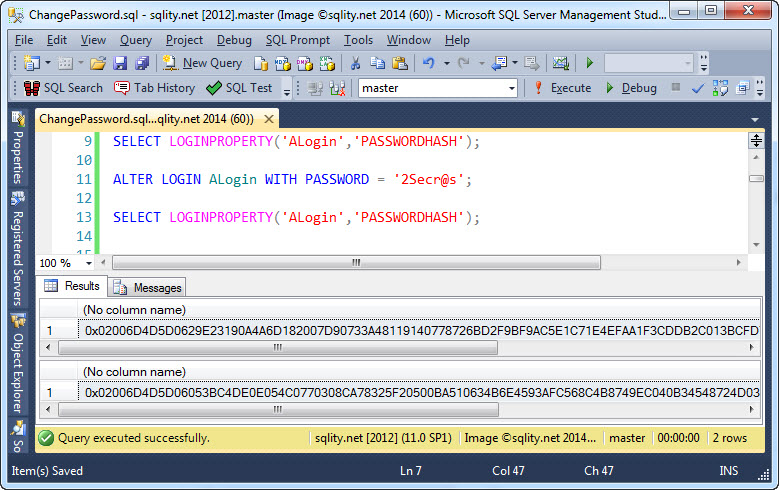
How to Change a SQL Login’s Password
-
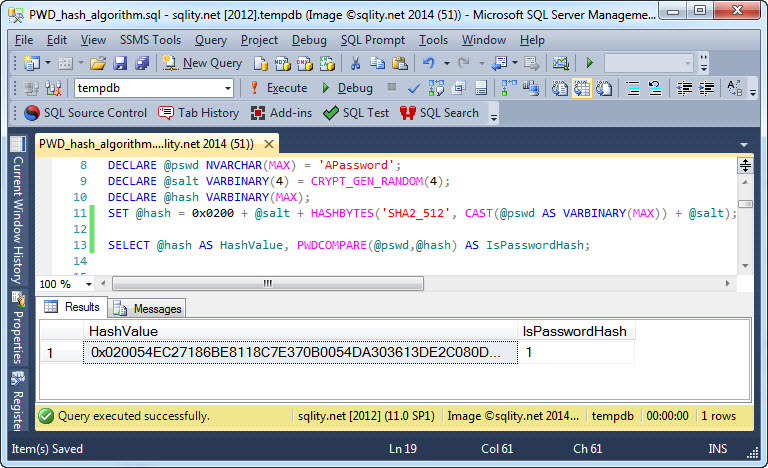
Hash Algorithms – How does SQL Server store Passwords?
-
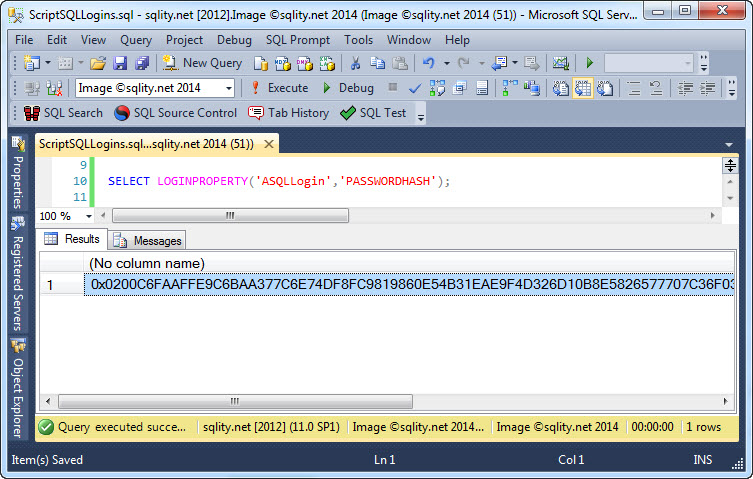
How to Re-Create a Login with only a Hashed Password
-
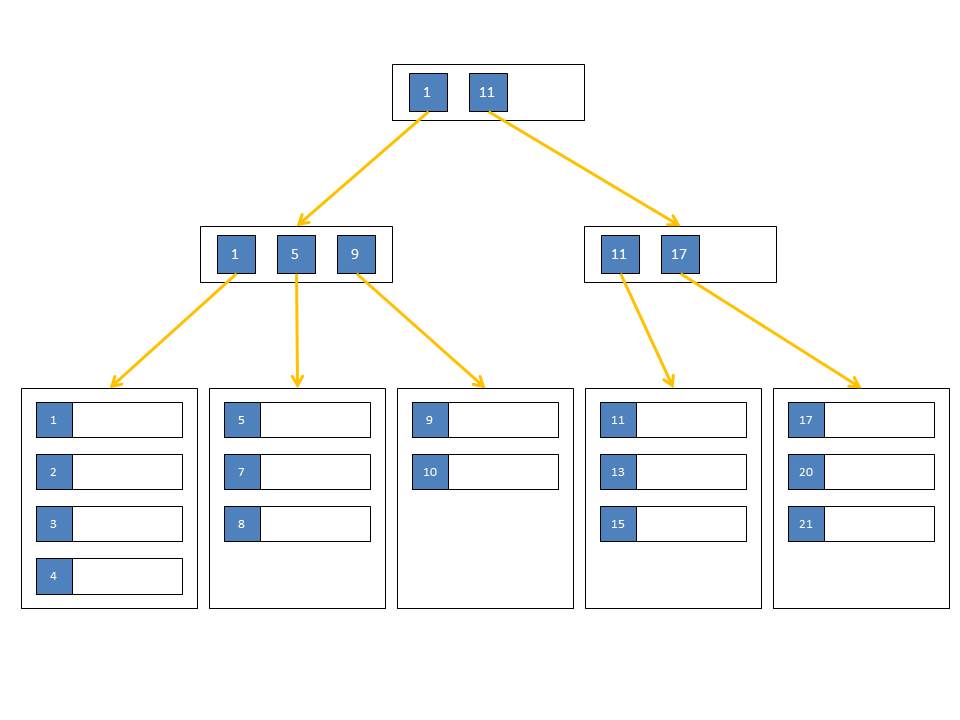
B+Trees – How SQL Server Indexes are Stored on Disk
-
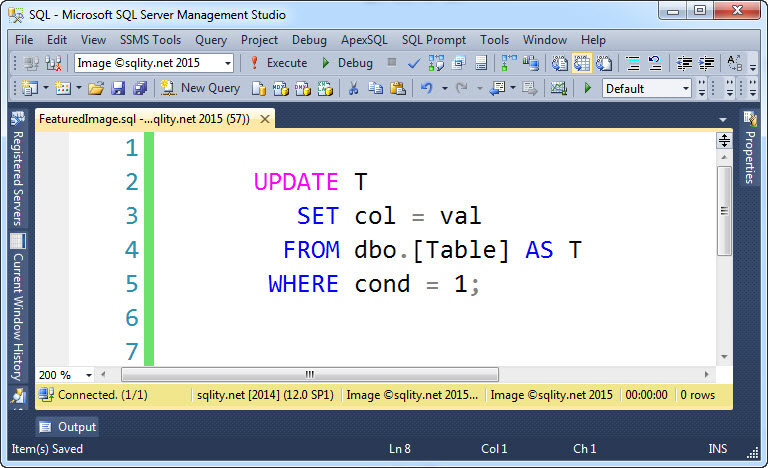
The Hidden SQL Server Gem: UPDATE from SELECT
-
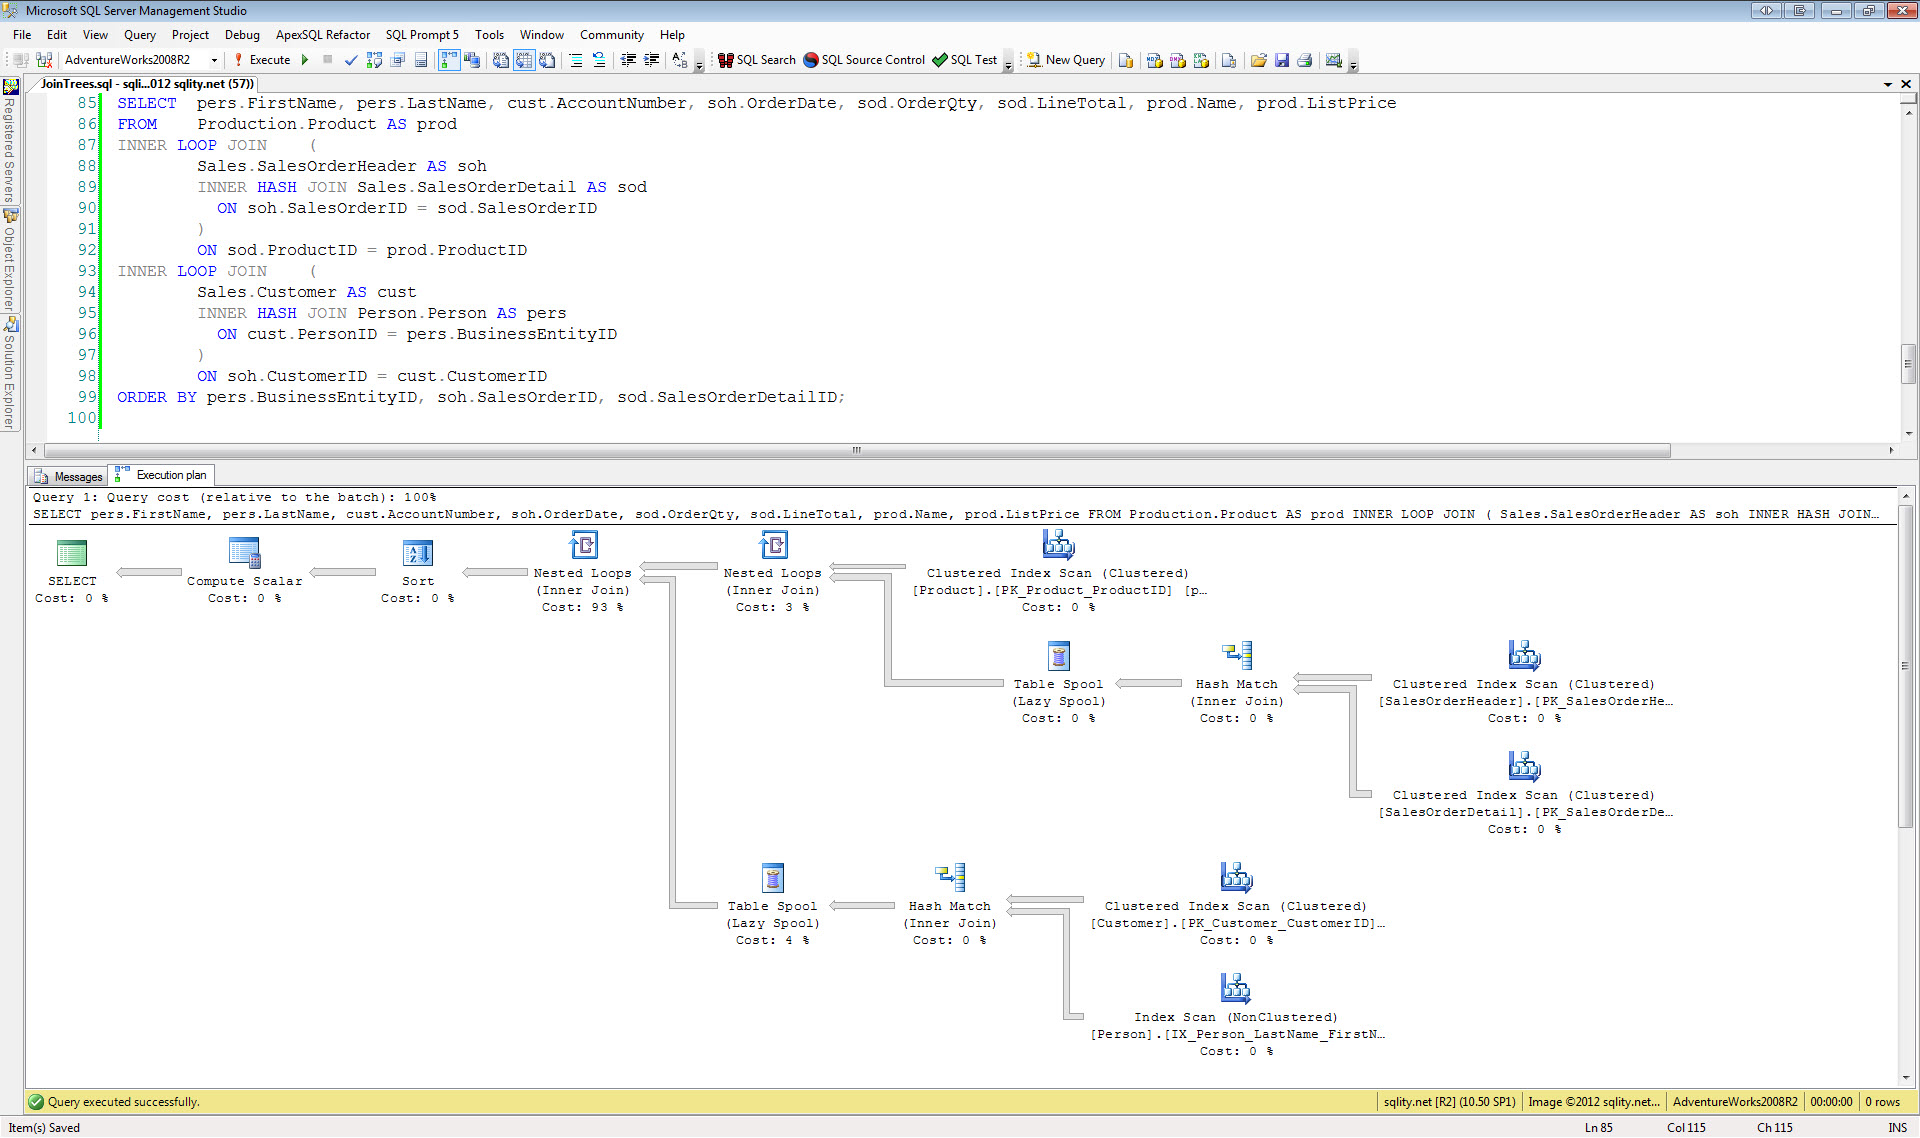
A Join A Day – Nested Joins
-
Determine the Uptime of a SQL Server Instance

-
A Join A Day – The Left Anti Semi Join
-
Log Reuse Waits Explained: LOG_BACKUP