Why CXPACKET Waits are not your Performance Problem
There is a lot of information out there recommending to do this or that to deal with the performance problems that you must have if you see CXPACKET waits.
All these recommendations build on the notion that the CXPACKET wait is a bad thing. Today I am going to explain why this is not the case. I am going to show you that the CXPACKETs are just one part of how the SQL Server engine works and that they do not indicate any problem.
Parallel Processing
First we need to dive into, how parallel processing of requests in SQL Server works. Every time SQL Server executes a query it does so using its execution plan. You can think of an execution plan as the compiled executable for the query. In this post I am not going to explain how SQL Server produces this plan, but if you want more detail I can recommend the book Inside the SQL Server Query Optimizer by Benjamin Nevarez (blog|twitter).
Under specific circumstances SQL Server can decide to produce a parallel plan. You can recognize a parallel plan by the yellow circles with two arrows on them that show up on some of the icons in the graphical plan:

You will also find at least one of the parallelism iterators:
![]()
They are called "Gather Streams", "Repartition Streams" and "Distribute Steams", and as they are always executed in parallel mode, they always appear with the yellow circle on them.
A parallelism iterator acts as thread control point. It takes a request from one ore more threads and passes it on, again to one ore more new threads. When the data is coming back, the iterator collects it and distributes it to the requesting threads. I am again not going to go into the details here. A good explanation can be found in Paul Whites(blog|twitter) article on simple talk: Understanding and Using Parallelism in SQL Server
I would like to call your attention to the word "new" in the above paragraph. Each icon in an execution plan represents an iterator and execution always starts with the left most iterator. It is the "SELECT" iterator in the above example. Each iterator requests rows from it's direct child iterators and then does some work with those rows. When a parallelism iterator is invoked it spawns n new threads and passes control to all of them. The number n is based on the type of the parallelism iterator and the current Degree Of Parallelism settings.
The original threads, after passing control to the newly spawned threads wait to receive rows back. This waiting is not done by spinning or polling. Instead the thread(s) enter a wait state and wake bake up once a row is available for processing. This allows the processor to be used for other worker threads.
The wait type that SQL Server reports for those threads waiting at a parallelism iterator is - you guessed it - the CXPACKET wait.
An Example
Let's look at an example:
DROP TABLE dbo.t1 ;
CREATE TABLE dbo.t1
(
i INT ,
t TEXT ,
c1 INT DEFAULT CHECKSUM(NEWID()) ,
c2 INT DEFAULT CHECKSUM(NEWID())
) ;
INSERT INTO dbo.t1
( i ,
t
)
SELECT n ,
REPLICATE('X', 200 + ( CHECKSUM(NEWID()) % 10 ))
FROM dbo.GetNums(1000000) ;
[/sql]
This creates the table "t1" and fills it with 1.000.000 strings of random length between 200 and 210 characters. The code uses Itzik Ben-Gan's GetNum function
to quickly create the one million rows.
Now run this select statement against that table:
[/sql]
Let's call this the "Count Query". It has the execution plan that was introduced earlier.
While this query runs, execute the following "Monitor Query" in a new window. Make sure to change the session_id variable to the SPID of the window executing the Count Query.
SELECT t.task_address ,
t.task_state ,
t.session_id ,
t.exec_context_id ,
wt.wait_duration_ms ,
wt.wait_type ,
wt.blocking_session_id ,
wt.blocking_exec_context_id ,
wt.resource_description ,
t.scheduler_id
FROM sys.dm_os_tasks t
LEFT JOIN sys.dm_os_waiting_tasks wt ON t.task_address = wt.waiting_task_address
WHERE t.session_id = @session_id
ORDER BY t.exec_context_id,wt.blocking_exec_context_id;
[/sql]
This query returns one row for every worker thread currently assigned to this query. A thread that is currently blocked might get more than one row, if it is blocked by more than one other thread. For each waiting thread it also shows what it is waiting for.
After about 10 seconds of execution of the Count Query, the Monitor Query returned this result on my machine:

As you can see, there are five different execution_context_ids. Each thread on a parallel query gets its own execution context. The first one, the thread the the query execution started on has always the id 0. The other ones get increasing consecutive numbers.
Thread 0 in above query covers everything up to the "gather Streams" iterator. From there to the "Repartition Streams" iterator threads 1 and 2 get to work in parallel. After that up on to the table scans the query is executed by threads 3 and 4. Those two are busily shoveling rows into the Hash iterator. Because a Hash is a blocking iterator (see Properties of Iterators by Craig Freedman(blog) for an explanation of this term), it will not produce any rows until it has consumed all incoming rows. This takes a little over 12 seconds on my machine. During this time the threads 0,1 and 2 are suspended, not taking up any processor resources and therefore not hurting any other thread or query. But they each crank up close to 12 seconds of CXPACKET wait time, for a total of 36 seconds.
Conclusion
The above example showed that any parallel query will show potentially very high CXPACKET waits. This is not an indication of a problem, but rather it is an indication that SQL Server is doing it's job properly, making sure that threads that do not have anything to do at the moment make room for other threads on the processors. So, if your system shows high CXPACKET waits, the only conclusion you can draw from that is, that it is using parallelism and that SQL Server's multitasking system is working as designed.
However, as the sys.dm_exec_requests (as well as the compatibility view sysprocesses) show only the wait type of thread 0, CXPACKET waits can potentially hide a real problem. If you know that you have a problem, use appropriate techniques to narrow down the source. If you don't know if you have a problem, CXPACKET will not help you to change that.
That means, that in almost all situations it is safe to ignore CXPACKET waits. I therefore recommend to add it to the list of waits to ignore in your monitoring queries.
Newsletter Sign Up

We know how to make a database not slow. We’ll help you do the same.
From the sqlity.net blog
-
How to identify the SQL Server Service Account in T-SQL

-
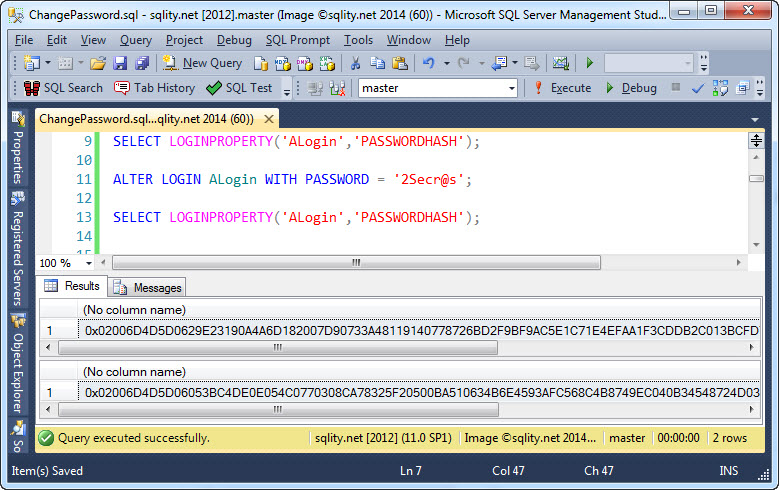
How to Change a SQL Login’s Password
-
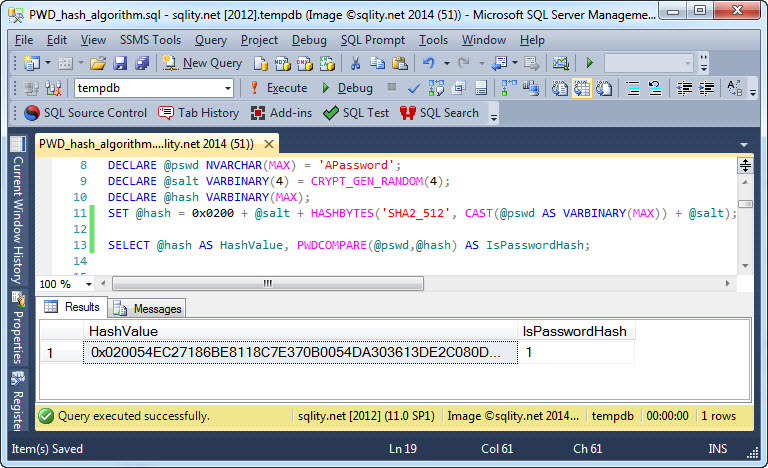
Hash Algorithms – How does SQL Server store Passwords?
-
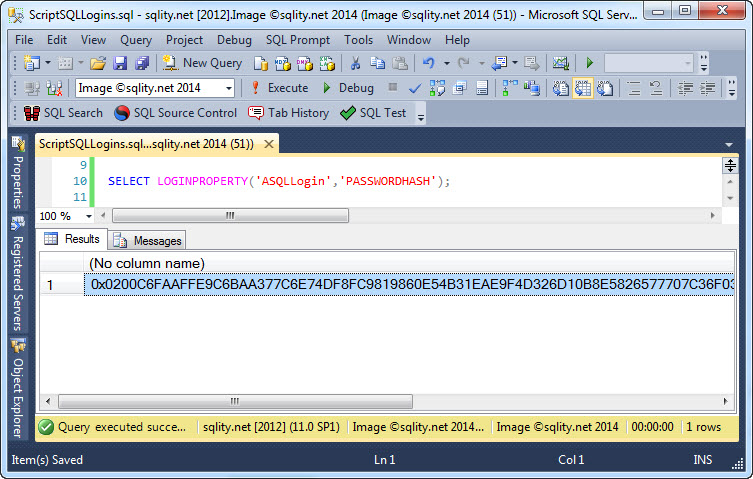
How to Re-Create a Login with only a Hashed Password
-
B+Trees – How SQL Server Indexes are Stored on Disk
-
The Hidden SQL Server Gem: UPDATE from SELECT
-
A Join A Day – Nested Joins
-
Determine the Uptime of a SQL Server Instance

-
A Join A Day – The Left Anti Semi Join
-
Log Reuse Waits Explained: LOG_BACKUP

2 Responses to Why CXPACKET Waits are not your Performance Problem