Tracing the Actual Execution Plan for a single Query
Introduction
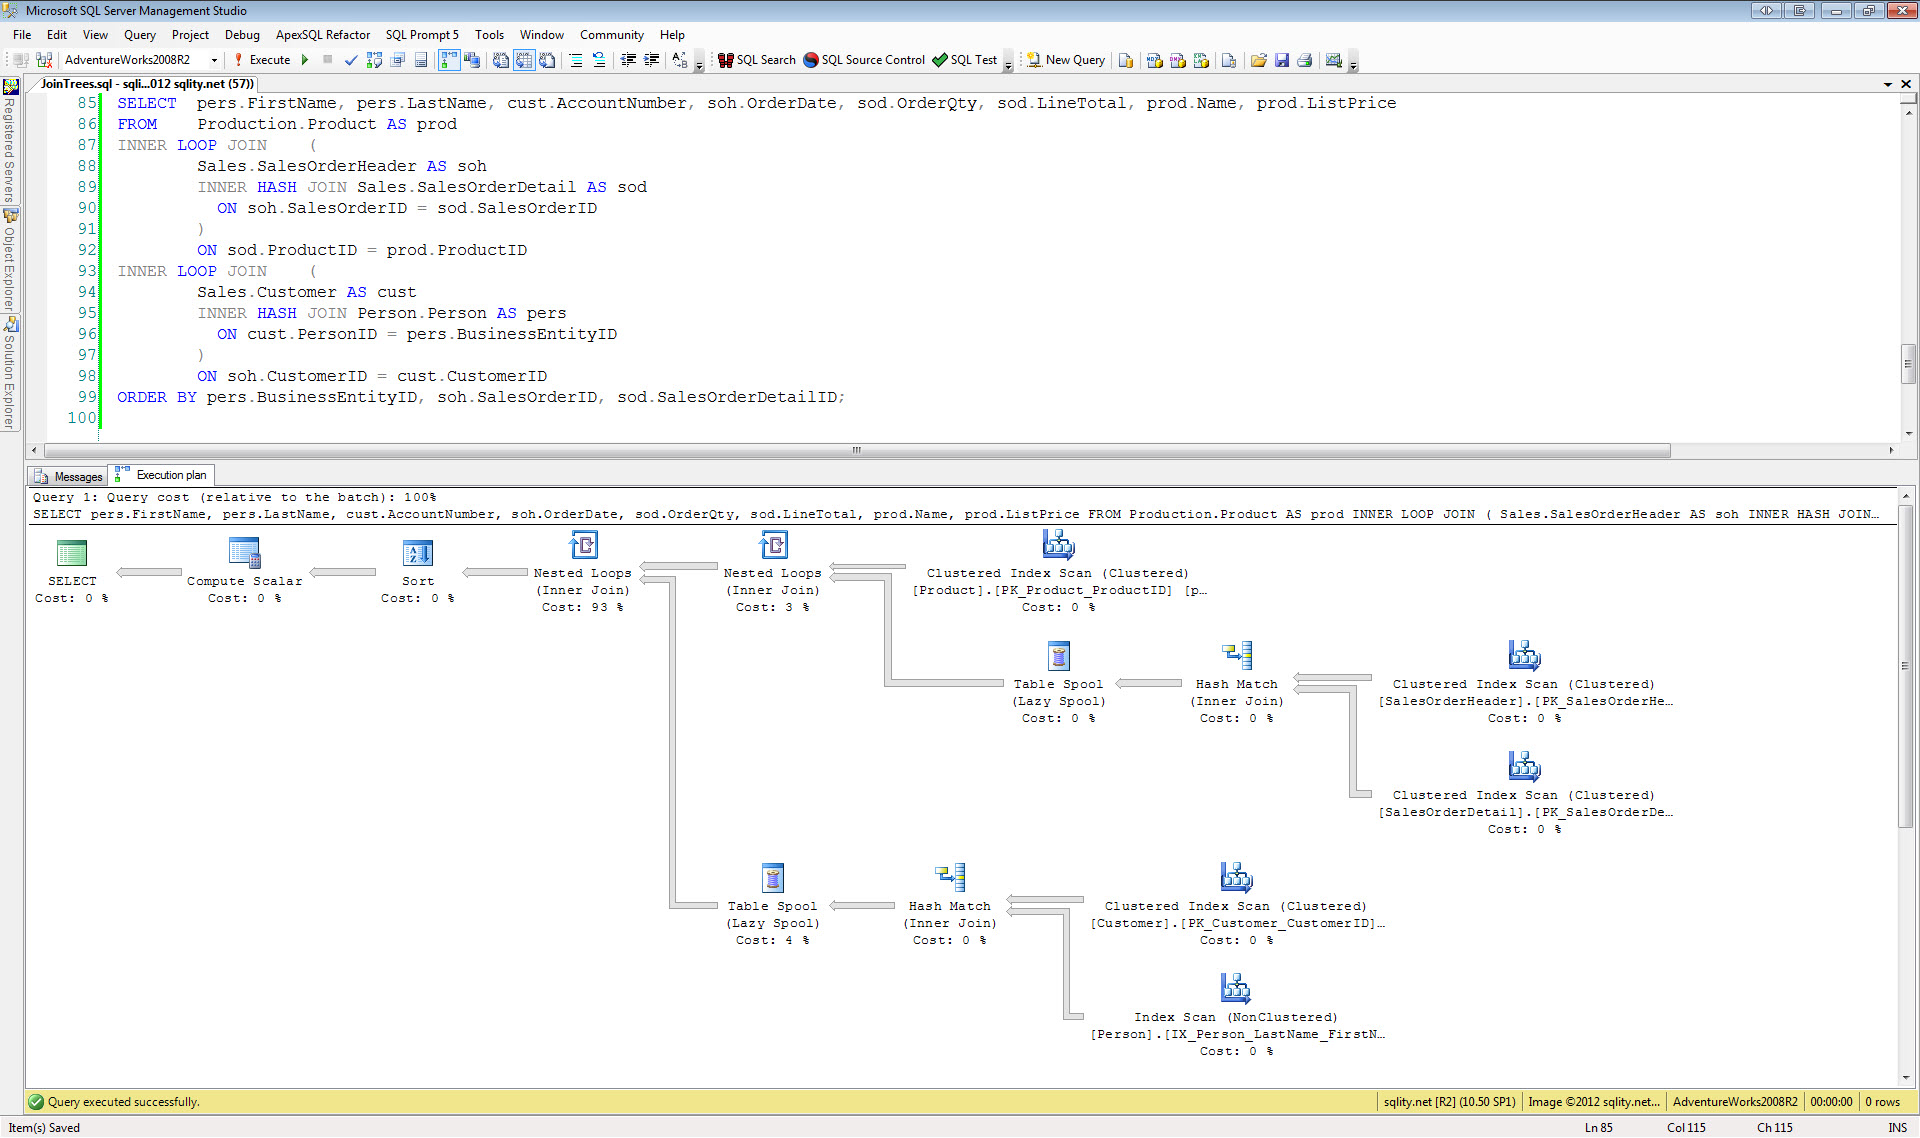
SQL Server offers several ways to get to the execution plan for a particular query. Most of them however only provide the estimated execution plan without actual counts and statistics. In this article we are going to look at a way to get to the actual execution plan of a particular query.
Tracing
The certainly easiest way to get the actual plan of a query is to actually execute it in SSMS while the "collect actual execution plan" option is turned on. However, sometimes you want to collect the actual execution plan for a query every time it gets executed in your production environment. The only way to do this in SQL Server 2008R2 and earlier was to run a trace and collect the "Showplan XML Statistics Profile" event.
The problem with this approach is that it is not trivial to restrict the collected information to execution plans of one query. That means that on a busy system thousands of these events will fire in a very short time. With the included XML execution plan the amount of data to be collected will be quickly overloading most production systems.
Filtering Options
If the statement you are interested in is inside of a stored procedure you are somewhat in luck, as it is simple to filter by the name of the procedure which is returned by the event in the ObjectName column.
However, if the statement is an ad hoc or a prepared statement, this simple option does not exist anymore. There are a few other columns you can filter by like the login name, but most of the time you won't have the option to single out a specific query to use different connection settings.
The next option would be to filter on the text of the query. However, the query text is unfortunately not included in this event – neither as separate column nor within the execution plan XML.
That leaves only one column that we can try to filter on, the execution plan itself.
While the execution plan is stripped of most of the query text, there are two types of names that are included in the execution plan: Parameter names and table alias names. Parameter names are only included if the statement is a prepared statement. Table alias names will be included in all types of statements that access a table. Be aware, that column alias names are not included in the execution plan.
Random Alias
While most often the table alias names are not unique between all the queries in a system, it is usually not too difficult to change a particular query to use some distinct character string as an alias name for one table. A change like that will not modify the query behavior nor will it influence the plan choice of the optimizer but it will us something to filter by.
The easiest way to come up with such an identifying name is to just use a random character string like "ir83n476s9d". Make sure however that the name of your choice begins with a letter. It also should not contain any special characters.
Once your query is prepared like this, you can easily restrict a "Showplan XML Statistics Profile" trace to only include this query by using a "Like" filter on the TextData column and setting it to "%ir83n476s9d%".
Conclusion
This simple trick allows you to filter the "Showplan XML Statistics Profile" event in a trace to fire only for a particular query. While it is not always possible to change a query to accommodate this, in many cases it is easy to do.
On final word of caution: When running traces in a production environment you should never use the SQL Profiler, especially when dealing with high-volume events like the "Showplan XML Statistics Profile" event. Instead setup your trace as a server-side trace to write the collected data to a fast, preferably dedicated drive. That way the performance impact on the system will be kept as small as possible.
Newsletter Sign Up
One Response to Tracing the Actual Execution Plan for a single Query
Leave a Reply
You must be logged in to post a comment.





Pingback: Capturing Parameters of a Stored Procedure Call - sqlity.net | sqlity.net